-
Overview
-
WAN Analysis allows you to view historical , as well as current, network analysis and reporting options It provides a consolidated view of your Verizon-provided network infrastructure, allowing you to use the same portal to obtain historical and current performance reports for selected transport (e.g., Private IP) and Managed Network Services (e.g., Managed WAN, Managed LAN).
Simple Network Management Protocol (SNMP) polling
To monitor the performance of your networks, the WAN Analysis Reporting server locates Customer Edge (CE) device elements by discovering them. When WAN Analysis discovers, it searches for elements using Simple Network Management Protocol (SNMP) agents at the Internet Protocol (IP) addresses of your CE devices. It then obtains information from the Management Information Base (MIB) of each device and creates individual elements based on that information.Note: If ordering Enhanced Traffic Management (ETM) Select with Netflow (below), then the two items listed below will apply to your WAN Analysis Reporting Tool.
Netflow Customer Product Administrator (NCPA)
You must designate a Netflow Customer Product Administrator (NCPA), together with your relevant contact details including name, phone number and email address. You will be responsible for notifying Verizon of NCPA changes. The NCPA will control who has access to your Netflow data.Netflow collector IP
This is the IP address of your Netflow collector. To receive the full benefits of your WAN Analysis Netflow reporting service, your CE device must be configured to allow SNMP polling and to export your application flow data (Netflow records) to the WAN Analysis Netflow collector that the application flow data will be sent to. This data will be collected and updated within the WAN Analysis reporting database for Netflow reporting.
This application enables:
- A quick, comprehensive snapshot of your network infrastructure
- Simplified network analysis with detailed hour-of-day and/or day-of-week views
- Validation of router performance
- On-demand reporting to allow end users to filter data
- Notification of potential issues so you can take action quickly
- Other various available WAN Analysis Reporting options
WAN Analysis Reports
WAN Analysis Reports vary, based on your service tier. Reporting features and capabilities include:- See the top utilized and under-utilized interfaces
- Monitor Quality of Service (QoS) queues and trends (EF, AF4, AF3, AF2, AF1, BE)
- Examine baseline application volume to identify periods of change
- View application breakdown of interfaces
- Automate or schedule reports to run daily, weekly and monthly
- Receive your reports link delivered to your inbox or export to your computer
- Setup alarms and alerts based on specific criteria
- See your circuit and device inventory for both Managed Network Services and Private IP
- Forecast bandwidth consumption needs and make more informed investments
- Address network performance problems quickly
- Manage the network for application delivery
- Mitigate the risk of change on application delivery
- Reports that provide predictive capacity planning
- Tools provide bandwidth consumption metrics for each individual site, providing a truly customer-centric view
- Reports that provide 12 months of historic view
- Multiprotocol Label Switching (MPLS) Provider Edge performance, such as circuit use and QoS information
- Ability to pull At-A-Glance, Top N and Trend reports.
- Overview
- Your Verizon team
- Preparing for a successful delivery
- Pre-requisites for activating WAN Analysis Reporting
- Business continuity plan
- Manage your account with Verizon Enterprise Center
- Your service/tiers of service
- WAN Analysis Reporting Network Diagram
- Reporting features
- Network Operations Center
- Training
- Frequently asked questions
- Support and glossary of terms
- Important Links
-
The Managed Service Implementation Manager is your primary contact regarding your Virtual Network Services deployment. The Managed Service Implementation Manager is responsible for the overall implementation and serves as your single point of contact throughout the course of the project. Your Managed Service Implementation Manager will arrange a Customer Kick-off Call/Order Verification Call to review and approve the Engineering Design Document and begin the implementation process.
Below is a list of activities to be performed by the Managed Service Implementation Manager:
- Schedule and run the Customer Kick-off Call/Order Verification Call.
- Perform overall project management services for the timely delivery and successful activation of the network with Verizon.
- Act as the ultimate point of escalation for the project team.
- Drive on-time delivery of the project and will pursue/escalate any unmet milestone deadlines.
- Host conference calls among all relevant parties.
- Develop the project plan jointly with you, the Verizon Account Team, and other support groups.
- Secure and matrix-manage all the resources necessary for project execution.
- Coordinate resource scheduling with Design and Implementation Engineers.
- Lead the development of processes and procedures required for network implementation.
- Oversee the completion of all steps in the defined process.
- Publish open action items and status reports.
- Establish reporting procedures with you and Verizon.
- Maintain the order tracking with milestone details for circuit/CPE Orders.
- Interface with Verizon organizations to collect status information.
- Act as the point of contact for any order-related issues.
- Confirm overall project delivery is compliant with the contract
- Conduct project closeout meeting. Transitions any remaining non-project issues for follow up.
- Provide re-engagement and, if applicable, change management instructions to you and the Verizon Account Team.
Note: E-mail communication sent by your assigned Managed Service Implementation Manager will contain their contact information along with escalation contact information in the signature section of the email.
-
Your Order Manager will communicate as needed in the form of periodic emails and/or follow up calls to provide status on key information regarding the implementation and activation of your Service. The Order Manager will work all aspects of the order directly with you and will gather any additional information needed. The Order Manager and Managed Service Implementation Manager will be in full communication with each other as your order progresses through completion.
-
Your Design Engineer is responsible for the physical and logical design and development of your network.
Below is a list of activities to be performed by the Design Engineer:
- Create your organization’s custom Engineering Design Document.
- Work with you to help develop an application Test Procedural Document (if applicable).
- Review & verifies your hardware and software configurations.
- Review redundancy, availability requirements, and security requirements.
- Make revisions to Engineering Design Document, as required.
- Review IP addressing scheme & request IP Addressing allocation for secondary addressing for network management.
- If required, implement the necessary controllers, either on premises or in the Verizon data center.
- Responsible for Proof of Concept Implementation (typically the hub and a few remotes), including testing of Managed Service.
- Verify visibility to your network for network management [i.e., management of Permanent Virtual Circuits (PVCs)] once the link has been provisioned.
- After a successful Proof of Concept implementation, will provide the activation/technical requirements template and transition the project to the Implementation Engineer.
-
The role of your Implementation Engineer is to act as the technical point of contact during any required device installations while providing virtual support on all managed equipment or circuits, taking over the network implementation from the Design Engineer after the first few sites are implemented.
Below is a list of activities to be performed by the Implementation Engineer:
- Communicate with you as necessary for required technical information.
- Confirm out-of-band modem and Layer 1, 2, and 3 connectivity for the hardware and access.
- Validate all necessary WAN circuits are passing IP traffic as designed.
- Build logical configurations for connectivity to your network.
- Act as your technical point of contact during device activation.
- Test devices to verify they meet standards for security and compatibility with your existing network devices.
- Testing of managed service policies as necessary.
-
If the project has a security feature (VNF), your Network Security Engineer is responsible for the logical design and implementation of your Security (VNF).
Below is a list of activities to be performed by the Network Security Engineer:
- Review redundancy, availability requirements, and security requirements.
- Make revisions to Engineering Design Document, as required.
- Provide activation/technical requirements template for applicable Security Services.
- If required, implement the necessary element managers, either on premises or in the Verizon data center.
- Work with you to apply your Initial Security policy configuration.
- Provide support for external server integration when required for Next Generation services.
- Confirm visibility to your Security VNFs for network management.
- Communicate with you as necessary for required technical information.
- Act as your technical point of contact during device activation.
- Test devices to verify they meet standards for security and compatibility with your existing network devices.
- Assist in testing of initial Security policies as necessary.
-
Upon successfully completing the requirements of your Virtual Network Services, your network services will be handed off to the Verizon Network Operations Center. The Verizon Network Operations Center will be responsible for incident and change management activities after your solution is accepted under management.
Within the Verizon Network Operations Center, your organization will have a Project Engineer assigned. Below is a list of activities to be performed by the Project Engineer:
- Verifies that the order meets the criteria for the Verizon Network Operations Center to manage the service
- Point-of-Contact for non-real-time-service issues
- Point-of-Contact for your Terminal Access Controller Access Control System (TACACS) account requests and password resets
- Point-of-Contact for your WAN Analysis account registration and password resets
- Sets up your Netflow Customer Product Administrator (NCPA) on the WAN Analysis Portal
- Maintains the Enterprise Service Portal (ESP), the MNS Database of Record
- Point-of-Contact for Customer contact notification and device inventory audit reports via ESP
- For more details, click on the Network Operations Center in the left navigation of this welcome kit.
-
A successful implementation of your new service requires your active involvement. We’ve provided the steps below to help you understand what to expect and how to prepare for a smooth installation.
Below are the steps you would follow to successfully receive access to your WAN Analysis Reporting Service.
- Confirmation of the activation of your Private IP circuit(s).
Note: The following situations may result in a delayed activation of your WAN Analysis Reporting service: delayed Private IP circuit activation, lack of customer response, local connectivity concerns, and lack of updating the reporting tool with the community string for each Private IP circuit.
- Verify receipt of your Verizon Enterprise Center portal /WAN Analysis Reporting entitlement/credentials email.
- Verify the reporting tier of your service prior to submitting an order to Verizon so that your order meets with any specific network reporting needs for your WAN Analysis activation.
- Confirm you have access to your WAN Analysis Reporting tool and user guides.

Customer action
You must be setup with Verizon Enterprise Center portal access in order to view WAN Analysis Reporting (in the Customer Reporting Management Center), see process below.
Set up community strings on all of your relevant routers (for Customer-Managed only). This would additionally require the collection of your entire router passwords/community strings.
Note: For Managed Services, you will have already provided this detail to your Managed Services Team.- Activate each Private IP site
Customer action
You must log into Verizon Enterprise Center portal and access WAN Analysis Reporting tool via Network Tools options. Once in the WAN Analysis Reporting you will have to activate each Private IP circuit with the proper community string, so that the tool can access your reporting statistics. Refer to the WAN Analysis Reporting Quick Start Guide found on the WAN Analysis Reporting Tool (under documentation section).
Customer action
You have to configure router to turn SNMP on. Refer to the WAN Analysis Setup and Troubleshooting guide for more details (found in the Customer Reporting Management Center).
- If ordering Netflow the following items are required
Customer action
You need to designate a Netflow Customer Product Administrator (NCPA) and provide relevant contact details to the Verizon Account Team or Order Manager including:
- Name
- Contact phone number
- Email address
Customer action
You must configure your Private IP router with the Netflow collector IP in order for the application flow data to be provided to Verizon.
-

-
WAN Analysis Reporting requires no special access or connectivity outside of a Private IP circuit. Verizon will add a management Permanent Virtual Circuit (PVC) to your Private IP network in order for the Reporting tool to access the Private IP network circuits.
Customer action
Verizon is not responsible for providing the community string for each circuit to allow the reporting tool polling of the SNMP data.
-
Community string is defined as the password of the device. Read only is all that is needed. No changes will be made to your settings by the WAN Analysis tool.
If Netflow was ordered, two additional steps will be required to activate the WAN Analysis Reporting Tool.
NCPA
You will be required to provide an NCPA (administrator) for the network. The administrator will have to be able to log into the tool and either approve or deny “access” requests to the Netflow data. This is required to help maintain your data privacy. The NCPA information should be provided to the Verizon Account Team, Order Manager, or via a production ticket to the Verizon Enterprise Center portal support desk. Until the NCPA is assigned no one will be able to view the Netflow reports until this data is updated within the tool.Netflow Connector IP
You will be required to configure your Private IP router with the Netflow Collector IP used to export the application flow data to the Netflow database for WAN Analysis. In order for your Netflow service to work properly, your CE device configuration should meet the following requirements:- The Netflow Collector IP address must be configured in your router to allow for Application Flow data to flow to the Netflow Collector database.
- The source IP address in your device configuration must match the IP address of the device in the WAN Analysis Customer Reporting Management Center.
- The destination port number for your configuration must be 9995.
- The interface to the configuration must match the interface enabled on the Customer Reporting Management Center. (Caution: check that the interface selected [primary or sub-interface] on the Portal matches the interface on the interface on which Netflow is enabled on your device configuration.)
Will I need scheduled support for my activation?
WAN Analysis Reporting is enabled for plug-and-play activation by you without assistance from any Verizon engineers. Should you have issues with your activation or configuration of Netflow, refer to the WAN Analysis Setup and Troubleshooting guide or contact your Verizon Account Team or Customer Care.
-
Service disruptions can hurt a company's bottom line and compromise an organization's mission. The economic and reputational imperatives of the current market have shifted the discussion from IT disaster recovery to an enterprise-wide business continuity focus.
Organizations of all sizes and industry types should have ongoing, enterprise-wide Business Continuity Programs that develop, prepare and exercise the various areas of continuity from critical business processes to IT service availability. The Business Continuity Program should address areas such as Emergency Response, Impact Analysis, Business Continuity Plans, Disaster Recovery Plans, Supplier Plans, Exercises, and ongoing Business Continuity program management.
The goals of today’s most relevant Business Continuity Programs are those providing organizations with an enterprise-wide business continuity focus, that not only includes strategizing and planning for IT service availability and disaster recovery but addresses the ability to manage all areas of critical and continuity activities of the program to help prepare and mitigate the impact from ever-increasing risks threatening to interrupt organizations’ critical processes.
Verizon helps our customers to effectively prepare and maintain continuity during planned and unplanned events to help reduce the risk and impact from disruptions. Please contact your Verizon account team for further assistance.
-
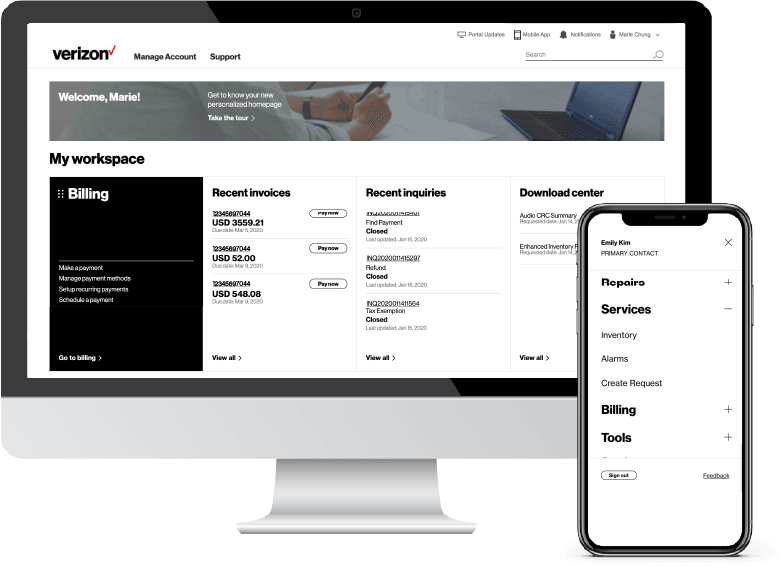
Easily Manage your Services Online
The Verizon Enterprise Center makes it easy for you to monitor, manage, analyze and optimize your Verizon products and services online. Available seamlessly between desktop, tablet and smartphone – you can act on your crucial data wherever your work takes you.
-
-
Register for the Verizon Enterprise Center
- Go to sso.verizonenterprise.com/ or download the My Verizon for Enterprise mobile app
- Click the ‘Register’ link
- Enter the invitation code you received to complete registration.
-
Your service/tiers of service
-
WAN Analysis Reporting offers multiple levels of customer-facing reporting as well as one additional add on for Verizon Network Operations Center (NOC) alert notification. Each tier builds upon one another to give you the flexibility to choose exactly the right level of reporting for your organization.
These tiers include:
- Provider Edge (PE) Statistics is the basic reporting package that is provided at no additional charge to all customers based on data from the Verizon Private IP Network. It is available for Private IP and Managed WAN Network Services customers only at this time.
- Standard Select reporting is based on customer device data and is available to all Unmanaged or Managed Wide Area Network (WAN)/ Local Area Network (LAN) / Wireless Optimization Service (WOS) (WAN Optimized Service) and Secure Gateway Retail and Remote Office customers. This tier provides automated “Health” reports of a customer network as well as the ability for users to run customized reports on basic networking technologies such as a WAN interface. It is available to our Managed WAN/LAN/WOS and our Verizon Rapid Delivery Private IP customers at no additional charge.
- Enhanced Traffic Management (ETM) is an uplift tier of Standard Select which may incur additional charges. This tier adds the ability to report on advanced networking technologies such as Quality of Service (QoS), Customer Edge (CE) - Customer Edge (CE) path performance, and high-level application data.
- ETM Select, another uplift tier, offers the ability for users to view and receive notification of performance alarms as well as have access to a near-real time traffic viewer tool.
- ETM Select with Netflow, another uplift tier, offers the ability to determine which hosts, protocols, and conversations are using bandwidth: on which network interfaces, and at what times. It is ordered and billed based on the amount of bandwidth being captured, which is tied to the access bandwidth.
- Threshold Proactive Performance Monitoring (PPM) is an add-on service specifically for Managed Network Solutions WAN / LAN customers. This feature will enable alarms and will automatically create tickets for performance degrading network conditions to the Verizon Network Operations Center for analysis. It cannot be ordered alone, at a minimum the Standard Select reporting tier of service is required for this feature.
Refer to the table below for an overview of the reporting levels and to determine which reporting options are available for your service. You may check your contract to see which reporting tier your organization has chosen.
WAN Analysis Reporting Tier Data Source & Metrics Managed WAN / LAN for Private IP Customer-Managed Private IP Service Provider Edge Statistics
Verizon MPLS core network edge routers
Metrics: inventory, utilization, packet drop
Included, optional (no additional charge)
Included, optional (no additional charge)
Standard Select
Customer Premises Equipment (CPE)
Metrics: inventory, CPE device, and interface
Included, no additional charge (Managed Customer and New Private IP customers only)
Optional
Enhanced Traffic Management (ETM)
Includes Standard Select with Customer premise equipment
Metrics: CE QoS Queue Utilization, site-to-site performance, and Cisco Network Based Application Recognition (NBAR)
Optional (*)
Optional (*)
ETM Select
Includes ETM
Metrics: near real-time CE Service reporting and alarms
Optional (*)
Optional (*)
ETM Select with Netflow
Includes ETM Select and adds Netflow
Metrics: near real-time CE Service reporting and alarms, utilization by application, and Top Talkers and Conversations
Optional (*)
Optional (*)
(*) To change your reporting tier, please contact your Verizon account team or visit your Verizon Enterprise Center Profile. Additional fees may apply.
-
-
Virtual Network Services Management Overview
Virtual Network Services are available with the following Management levels: Full, MSS Management or Monitor Only. Full Management means that Verizon fully manages all parts of the service including any underlying hardware. MSS Management is available for Virtual Network Services – Security only. In this case the MSS SOC will manage the security service VNF component. For “Monitor Only”, Verizon is responsible for the underlying hardware only.
Note: Your level of service is based on your contractual agreement with Verizon.
-
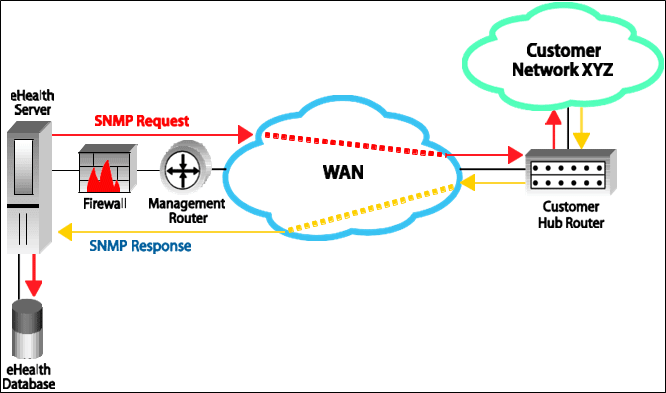
Below is a simple representation of WAN Analysis Reporting to your network.
-
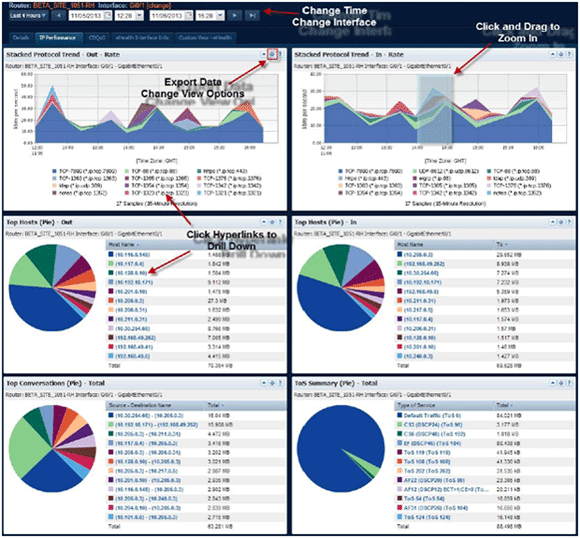
There are several highly informative features found within WAN Analysis Reporting to help provide your organization details on your Private IP usage. The reporting functions below can be accessed within Verizon Enterprise Center portal.
Available reports
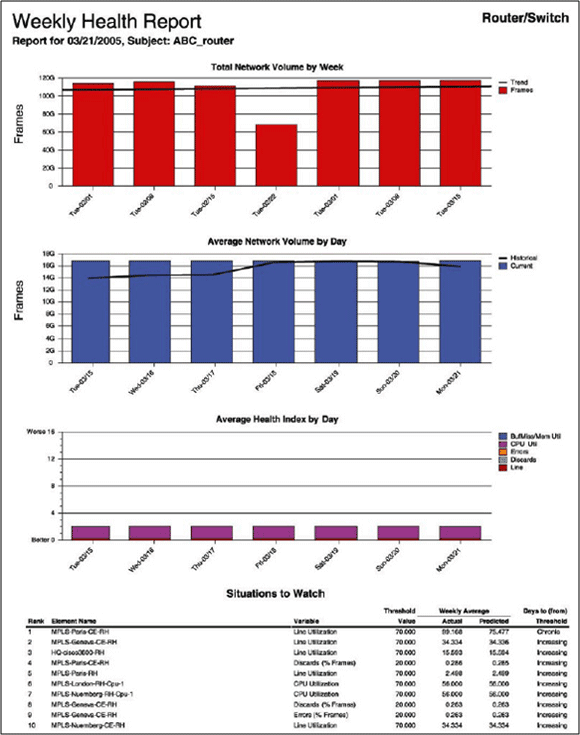
Health Reports
WAN Analysis Health Reports are an important part of the proactive management capability of the tool. Health Reports are a set of comprehensive reports that leverage historical data over various time periods. Using historical data from the WAN Analysis database, Health Reports help to analyze trends, calculate averages, and evaluate the health of the infrastructure.With this information, you can determine how efficiently your applications and systems are running, whether critical resources are available, and what capacity planning initiatives make sense. These reports are run automatically by the WAN Analysis system and will be available in the Reports section of Verizon Enterprise Center portal.
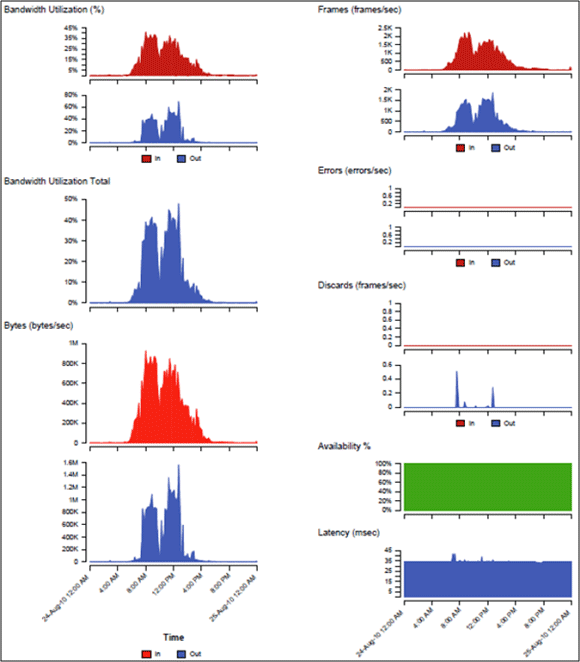
At-a-Glance Report
The At-a-Glance (AAG) report is used to drill-down on your problem elements. It automatically correlates key performance and availability statistics in a single-page presentation for a specified time interval. At-a-Glance reports can reduce time spent troubleshooting problems by automatically capturing performance data and providing it in a uniform presentation. They provide extraordinary detail for all the critical performance parameters available.Presenting the variables on identical X-axes allows you to see the interaction of critical performance indicators during particular events. When an AAG report is generated, you specify the following parameters:
- The element to run the report against.
- For example, a router, LAN/WAN port, a frame relay PVC, a server or a service process.
- The sample size which can be ―as is, hourly, daily, weekly, monthly, or quarterly samples.
- For example, if a report is generated over a long reporting period, the weekly monthly or quarterly samples may be more appropriate.
- Report time, such as yesterday, last week, last month, or any user-specified period.
- An option to include only certain samples.
- For example, a report can be generated for a month but which only includes samples from Monday to Friday and from 8:00 a.m. to 8:00 p.m.
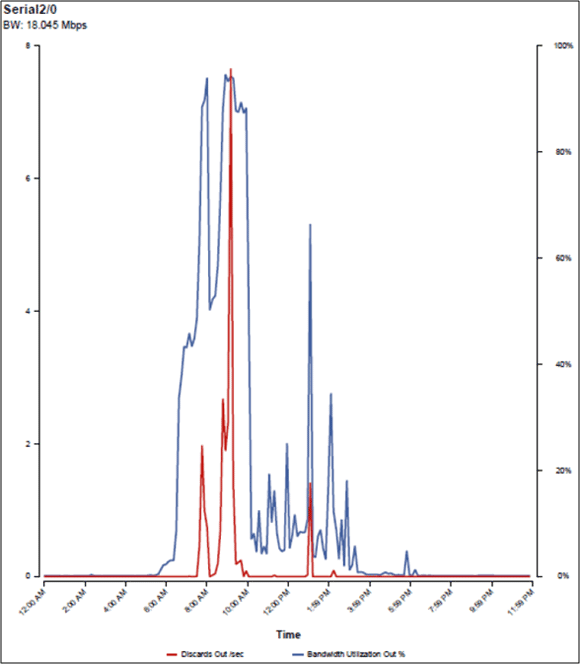
Trend Analysis
The Trend Analysis report is a very useful troubleshooting tool. It produces a single graph with a common time scale. One variable can be plotted for up to ten elements (or groups) over any time period. Up to ten variables can also be plotted for a single element (or group) over any time period. The variables that can be selected for an element or a group depend on the element type. Because of its flexibility, a Trend report can be used to reveal traffic patterns over time, as well as relationships between elements (or groups) and between variables.If your Trend report indicates that two variables are correlated, then it suggests a causal relationship between them. For instance, if the bandwidth utilization and the collision rate on an Ethernet segment show a strong correlation, then it suggests that the high bandwidth utilization may be causing the problem. Similarly, a strong correlation between bandwidth utilization and discards suggests that high bandwidth utilization is causing network congestion, which in turn causes packets to be discarded.
Below is an example of a single-element, multivariable Trend report. It shows the relationships between bandwidth utilization and the number of discarded frames. In this case, there is a strong correlation between the two variables. Because bandwidth utilization was high, the circuit became congested, and the router had to discard frames as a result. A high rate of discards will cause timeouts and re-transmissions at the higher layers, thus introducing long delays. Since bandwidth utilization was shown to be the cause, either traffic has to be diverted from the circuit or its bandwidth will have to be increased.
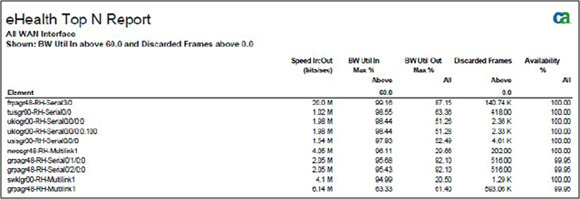
Top N Report
The Top N Report provides another powerful tool for identifying your problem elements. It can generate a list of elements sorted by any variable; a list of elements that exceeds or falls below a certain threshold value; and a list of all elements. It supports up to four different variables in each report. For example, you can specify a complex search for all elements whose bandwidth utilization exceeds 80% and whose availability falls below 99.9% and whose latency exceeds 50ms.This report can be used to identify elements that share specific performance characteristics. For example, to identify over-utilized elements, you might generate a Top N report for all elements whose bandwidth utilization exceeds 90%. Similarly, to identify problem elements, you might generate a report for all elements whose availability falls below 95%.
Below is a sample report that helps identify elements that have high utilization and discards. We can also include other non-filtered attributes such as availability to see if it was affected as well.
Netflow (ETM Select with Netflow)
WAN Analysis Reporting ETM Select with Netflow provides you comprehensive, enterprise-wide visibility into the composition of your network traffic. It helps you to make better informed infrastructure investments, to solve performance problems quickly, and to fine-tune your network infrastructure for better application performance.ETM Select with Netflow can help you answer the following questions:
- What is the composition of my network traffic?
- When is my network being used and by what devices or hosts?
- How does traffic flow across my network? Which data centers are serving which users?
- How much of my bandwidth is consumed by hosts, protocols and conversations?
- How does usage on my network interface break down hosts, protocols and conversations?
In order to provide this information, WAN Analysis Reporting uses data obtained from implementations of the Internet Protocol Flow Information Export (IPFIX) standard. IPFIX implementations measure and record data about the traffic that passes through a customer edge device, such as a customer Wide Area Network (WAN) router. This data can be exported to an external collector, such as the WAN Analysis Reporting Netflow collector located in the Verizon network. IPFIX was designed around Cisco’s proprietary protocol, NetFlow.
The following IPFIX implementations are supported by WAN Analysis:
- NetFlow v5, v7, v9 from Cisco devices
- J-Flow from Juniper Networks devices
- sFlow v2, v4, and v5
- IPFIX from Nortel and other devices
Cisco IOS NetFlow is the most common IPFIX protocol used by WAN Analysis Reporting ETM Select with Netflow customers.
WAN Analysis Reporting with Netflow uses IPFIX data to provide the following information:
- Ready to use executive dashboards for high-level network visibility
- Comprehensive reports at one-minute granularity for every interface on the network
- Top hosts (talkers) and conversations
- Trend data for analyzing trends in application use over time
- User configurable thresholds and scheduled email options
- Comprehensive view into Quality of Service (QoS) policy utilization to determine if applications are receiving the appropriate Quality of Service throughout the network
- Automatic protocol breakdown per interface with customizable protocol definitions
- Eight-hour, daily, weekly, monthly, yearly, or customizable reporting time periods
- Reports available in several formats with the ability to schedule reports
See the report example below:
Threshold Proactive Performance Monitoring (PPM) - For Managed Customers only
Threshold Proactive Performance Monitoring (PPM) – allows the WAN Analysis reporting and performance management platform, powered by CA Technologies, to look for and analyze certain PPMs related to proper network performance and to proactively alert the network management center, via a fault manager server, of network conditions that exceed predefined PPMs. While not necessarily resulting in a down condition to your network, these PPMs are things that warrant investigation in an effort to avoid network down time and keep your network operating at an acceptable level.The primary objective of PPM is to identify relatively subtle network and system problems and provide an opportunity to correct them before such problems can have a major impact. To achieve this objective, PPM typically leverages data collected by the performance management system into near real time notification of network and system performance problems.
When a problem is detected, a Verizon priority 2 trouble ticket is automatically created and the problem is submitted to the responsible Verizon Network Managed Services engineering group for analysis.
Conditions for which proactive management can be desirable include:
- Transport conditions
- Link conditions
- Physical / Device conditions
After each collection period the collected data is analyzed against performance profiles defined on the performance management system. These profiles define acceptable performance characteristics on a given element type. Profiles can specify performance characteristics across multiple collection periods to catch intermittent problems that are not normally enough to cause a total network communications failure. When PPMs defined on the performance manager are exceeded, a rule written within the performance management system sends a PPM trap to the fault management system and automatically opens a trouble ticket for the engineers within the Managed Network Solutions group who react in accordance with procedures.
The fault manager presents PPM trap information to network operators for their action. The fault manager parses details from the PPM traps and includes them in alarm notifications. When error conditions change or abate, the fault manger receives PPM traps to modify or clear alarms. This capability is available for Frame Relay, Private IP, ATM, etc.
The following PPM rules listed below are currently provisioned for Managed WAN PPM.
Note: Rule set subject to change:
Transport Rules
- Round Trip Delay – Level 1
Objective: When average round trip delay is 100 % over baseline and average response time is over 200 ms for 180 of 240 minutes, a notification is presented.
- Round Trip Delay – Level 2
Objective: When average round trip delay exceeds 250ms for 480 minutes out of a 480 minute window, a notification is presented.
- Packet Discard Rate
Objective: When average upper layer for User Datagram Protocol (UDP) or Internet Control Message Protocol (ICMP) ping packet discard rate exceeds 5% for 480 of 540 minutes, a notification is presented.
- Jitter
Objective: When jitter exceeds 30ms for 60 minutes of a 4 hour window, a notification is presented.
Link Rules
- Errors on WAN port
Objective: When errors on a physical WAN interface exceed .8% for 240 of 720 minutes, a notification is presented. Error count includes: crc, runt jabber, giant.
- Errors on LAN port
Objective: When errors on a physical LAN interface exceed .8% for 240 of 720 minutes, a notification is presented. Error count includes: crc, runt jabber, giant.
- Packet Discard Rate
Objective: When average discard rate exceeds 5% for 60 of 240 minutes, a notification is presented.
Physical / Device Rules
- CPU Utilization – Level 1
Objective: When CPU Utilization exceeds 90% for 30 of 240 minutes, a notification is presented
- CPU Utilization – Level 2
Objective: When CPU Utilization exceeds 80% for 60 of 240 minutes, a notification is presented
- Memory Utilization
Objective: When free memory falls 50% below baseline for 120 of 720 minutes, a notification is presented
- Temperature – Level 1
Objective: When temperature is abnormal for 30 minutes of one hour, but has not reached critical level, a notification is presented
- Temperature – Level 2
Objective: When temperature has reached critical level for 30 minutes of one hour, a notification is presented
- Power Supply – Level 1
Objective: When power supply status is abnormal for 30 minutes of one hour, but has not reached a critical level, a notification is presented
- Power Supply – Level 2
Objective: When power supply status has reached a critical level for 60 minutes of one hour, a notification is presented
- Fan Status – Level 1
Objective: When fan status is abnormal for 30 minutes of one hour, but has not reached a critical level, a notification is presented
- Fan Status – Level 2
Objective: When fan status has reached a critical level for 60 minutes of one hour, a notification is presented
Entitlements
For you and your employees to receive the entitlements necessary to see all of our WAN Analysis Reporting features contact the Verizon Enterprise Center helpdesk and tell the representative that you want to set-up your Verizon Enterprise Center profile to use the WAN Analysis application. Provide the representative with the circuit ID you wish to use on the WAN application.With Netflow, an administrator has to be established to manage the person(s) who can access application data. All users wanting access to the application data can do so via the WAN Analysis reporting tool by selecting “User Status”, then “Product Access”, and then select “request access”. The administrator will receive an email to approve or deny access. Refer to the “help” option on the reporting tool for more details.
U.S.: Call 800-569-8799. Live Chat is also available M-F 8:00 a.m. ‒ 8:00 p.m. U.S. Eastern Time, or you can send an e-mail to vec-support@verizon.com.
EMEA: Contact your local Verizon helpdesk or your Verizon Account Representative for assistance. You may also e-mail us at: vec-support@verizon.com.
Asia-Pacific: Contact your Verizon Account Representative for assistance. Live Chat is also available M-F 8:00 a.m. ‒ 8:00 p.m. U.S. Eastern Time, or you can send an e-mail to:APAC.VEC.Support@intl.verizon.com.
Latin America: Contact your Verizon Account Representative for assistance. Live Chat is also available M-F 8:00 a.m. ‒ 8:00 p.m. U.S. Eastern Time, or you can send an e-mail to Latin America: cslat@verizon.com.
You can also set up the entitlements through your Verizon Enterprise Center profile.
Verizon Enterprise Center Homepage -> Network Tools -> Network Reporting -> click on View My WAN Analysis Reports - The element to run the report against.
-
-
Upon successfully completing the requirements of your Virtual Network Services, your network services will be handed off to the Verizon Network Operations Center (NOC).
Your MSPM will send a “handoff” email to you and anyone else you designate within your organization. The email will:
- Confirm your network is officially under management
- Provide you with points of contact
- Explain the process to report in-scope and out-of-scope network changes
-
Customer action
If you do not receive a handoff email from your MSPM, please contact your MSPM directly to determine the timing of the transition of your network services to the Network Operations Center.
The Network Operations Center performs automatic alarm detection, fault isolation, trouble-ticket generation, event and maintenance correlation, customer notification and updating, in many cases without the manual intervention of network support staff. The Network Operations Center also provides deep visibility into the circuits and equipment that make up your network to help more effectively manage your services.
The Network Operations Center monitors your networks through a combination of Simple Network Management Protocol (SNMP) polling/traps, Internet Control Message Protocol (ICMP) pings, and SYSLOG messages from devices.
The Network Operations Center can handle a broad range of transport and network types to support Managed SD WAN Services:
- Private IP
- IPSec VPN
- Internet Dedicated Services
- Internet Broadband Services
- Third Party MPLS (requires agreement with the customer to have VZ Management VPNs in the customer’s VRF domain)
- Third Party Internet
- Wireless (ordered through Verizon)
-

-
Training
The Customer Learning Portal provides Verizon Business customers with training and resources for products, systems and tools. To access the Customer Learning Portal, please go to: https://customertraining.verizon.com.
WAN Analysis Reporting is supported on Verizon’s Private IP network, Managed Wide Area Network (WAN), and Managed Local Area Networks (LAN).
Once your Private IP network and / or Managed WAN Service is fully activated with WAN Analysis Reporting, the tool will begin to pull statistics. After your Verizon Enterprise Center portal User ID and Password is established with WAN Analysis Reporting, you will have access to view the statistics.
Ensure you have provided NCPA to your Verizon Account Team, Order Manager, or Verizon Customer Care. If you are unsure that the NCPA information was provided, contact Verizon Customer care to open a ticket through the Verizon Enterprise Center portal or through Verizon Customer Service (24 x 7).
If the NCPA was established, ensure that you have requested access to the Application data. Use the WAN Analysis “HELP” option to find the process to request Netflow reporting access.
Not at this time.
There is no limit to the number of devices / circuits that I can manage with the tool. The only requirement is that the router or switch device the circuit is activated on must be capable of SNMP polling and that the Product was ordered on the specific circuit or Managed device.
WAN Analysis Reporting is available around the globe where ever Managed Network Services or Private IP services are offered. The product can only be sold in conjunction with Managed Network Services and or Private IP.
When you are in the main screen of the tool bar, you will find “Documentation” and “Help” within the main red bar on the right side.
You can open a ticket with the Verizon Customer Service (24 x 7).
You can open a ticket with the Verizon Customer Service (24 x 7) and ask them to change the NCPA on the assigned network. Customer Service will provide the updated information to the vendor (CA Technologies) to update within the WAN Analysis Reporting tool.
Since many applications share the network, it can be a challenge to know when an application performance problem is occurring because of the network and then how to correct it. Application performance tools that use flow collectors and/or probes can help you understand what applications are running on your network and whether the quality of service settings are correct.
Network managers can use the WAN Analysis reporting platform as a convenient and fast way to activate network performance monitoring tools that provide application-level visibility. Verizon recommends analyzing your network traffic using these tools prior to opening a ticket. Netflow reporting will provide application flow analysis. Contact your Verizon Account Team to upgrade your service.
If you need to change your WAN Analysis Reporting tier level, you may contact your Verizon Account Team as there is likely a contractual change needed. Additional charges may also apply.
Verizon offers the WAN Analysis reporting platform to provide you with utilization, trending, and capacity planning reports. By using the Trend and Top N report in this platform, you can identify and measure circuit utilization and develop trend reports.
WAN Analysis Reporting provides multiple tiers of service with Enhanced Traffic Management (ETM) or ETM Select tier which provides reporting at the QoS levels (EF, AF4, AF3, AF2, AF1, BE). Refer to your Private IP QoS descriptions for more details. QoS reporting will show statistics based on your activated Private IP QoS levels.
To find information on your Private IP service, you may check information in the Private IP welcome kit. Any other questions should be brought up to your Verizon Account Team or submit a ticket/inquiry through Verizon Enterprise Center portal.
Billing for your WAN Analysis Reporting will commence within 30 days of service availability when your service has been activated and is available for use.
Note: Each site may have different activation dates, which would effect when those bills would be received.
User Guides for billing and invoices are available on the Customer Learning portal.
- Online Inquiries for all Services: When viewing your invoice online in Verizon Enterprise Center, click “Create a billing Inquiry” click “Create an Invoice Inquiry” from the Invoice Summary screen and follow the instructions to create and monitor an online inquiry. You may also track or create a trouble ticket from the portal homepage under the “Quick Tasks” section (no login required).
- Live Chat: you can chat online with Verizon Customer Care which can be accessed from the Support tab.
-
Support and glossary of terms
-
Support
If you have any issues or concerns during your WAN Analysis activation process, please reach out to your assigned Order Manager and they will assist you through the entire experience.
Their contact information will be found on the e-mail communications they send you.
Netflow Customer Product Administrator (NCPA)
Customer must designate a Netflow Customer Product Administrator (NCPA), together with relevant contact details including name, phone number and email address. Customer will be responsible for notifying Verizon of NCPA changes. The NCPA will control who has access to the Customer’s Netflow data.Netflow Collector IP
This is the IP address of the Netflow collector. To receive the full benefits of the WAN Analysis Netflow reporting service the CE device must be configured to allow SNMP polling and to export application flow data (Netflow records) to the WAN Analysis Netflow collector that the application flow data will be sent to. This data will be collected and updated within the WAN Analysis reporting database for Netflow reporting.Simple Network Management Protocol (SNMP) Polling
To monitor the performance of networks, the WAN Analysis Reporting server locates CE device elements by discovering them. When WAN Analysis discovers, it searches for elements using Simple Network Management Protocol (SNMP) agents at the Internet protocol (IP) addresses of the CE devices. It then obtains information from the Management Information Base (MIB) of each device and creates individual elements based on that information.
Services and/or features are not available in all countries/locations, and may be procured from in-country providers in select countries. We continue to expand our service availability around the world. Please consult your Verizon representative for service availability. Contact us.